
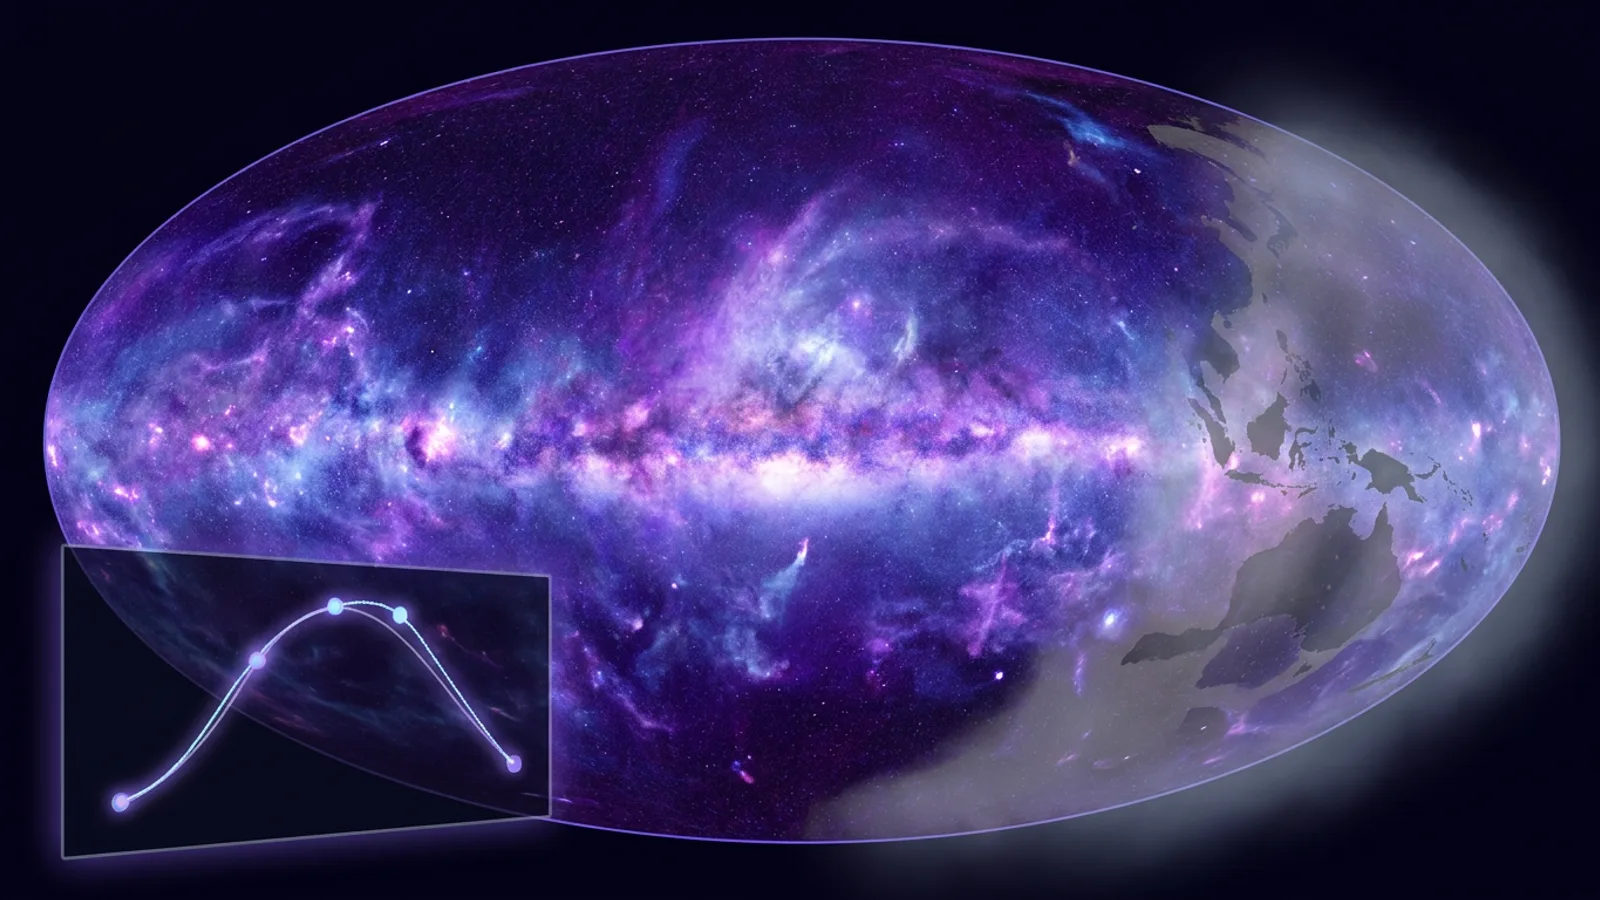
An artificial intelligence system has done in months what no scientific team had finished: a complete map of the sky in ultraviolet light. The result is signed by Claude Science, Anthropic's system, and explained by astrophysicist Brice Ménard of Johns Hopkins University on the company's website.
The case is of interest now because it does not describe a spectacular discovery, but rather something more routine in science: a data cleaning and fusion job that is often shelved due to how laborious it is, and which has been resolved here by delegating it to AI agents.
A decades-old gap in the sky map
Ultraviolet light shows something that optical telescopes and the human eye cannot capture: dust illuminated by radiation from stars. This dust appears in clouds around young stars or in the remains of stellar explosions.
Until now, there was no complete map of this type of light for the entire sky. The reason is physical: the ozone layer blocks ultraviolet radiation, so it can only be measured from space. This limits observations to specific space missions, each with its own coverage and limitations.
What NASA’s GALEX mission left uncovered
NASA's GALEX mission covered approximately two-thirds of the sky. However, it left out some of the brightest regions of star formation, areas especially relevant for studying cosmic dust and the birth of new stars.
The result was a map with significant gaps. Completing it required cross-referencing data from different space missions, each with its own formats and calibrations. It is a technical, unglamorous job that is easy for research teams to postpone.
How Claude Science coordinates its AI agents
According to Anthropic, Claude Science coordinated several artificial intelligence agents that divided the task into three phases. First, they downloaded data from multiple space missions. Then, they calibrated them to make them comparable. Finally, they merged them into a single unified map.
It is the type of work that can consume weeks of human dedication without resulting in a prominent publication. That is where the interest of the case lies: it is not a new scientific finding, but a data engineering task that had been pending for a long time.
Inpainting: filling in the sky that no one observed
Even so, there were areas without direct measurement. To cover them, the agents applied a technique called inpainting, in which a model learns from available data to estimate the remaining gaps. It is the same principle used to restore photographs, applied in this case to astronomical measurements.
It should be clear that this reconstructed part is not equivalent to a real observation, but an estimate. That is why quality control is key: in the tests performed, the model's predictions deviated on average by 10% from the actual measurements. It is a margin of error that must be taken into account when working with those regions of the map.
A map designed for teaching
Anthropic presents this map as educational material. The idea is to show how artificial intelligence can take care of tedious data work that researchers would otherwise struggle to address.
Ménard suggests that many scientists have been postponing similar projects due to their complexity, and that AI could now make them more viable. This is a hypothesis put forward by a researcher on the website of the company that develops the tool, so it should be taken as a perspective to be confirmed, not as a fact already demonstrated on a large scale.
What can be taken from this ultraviolet map
For those who work with data from various sources, the project leaves some practical guidelines:
It is worth reviewing which of your own projects are shelved due to the cost of preparing and calibrating data from different sources. This is precisely the type of task that in this case was delegated to AI agents.
If you use data reconstructed through inpainting, it is advisable to check how much they deviate from actual measurements. In this map, the average deviation was around 10%.
The context of the project
It is important to distinguish between directly measured areas and estimated areas before drawing conclusions. A region filled in by a model is not equivalent to a direct observation of the sky.
One example illustrates the practical utility: a group studying dust around a star-forming region that GALEX did not record could now start from a continuous map, rather than having to build their own data fusion from scratch.
What it implies for astronomical research
For researchers, this map provides a complete ultraviolet reference of the sky to compare with their own data, as well as a concrete example of how to distribute tasks such as downloading, calibrating, and merging scattered sources among AI agents. For those who want to use it, it is recommended to consult the documentation published by Anthropic and Ménard to identify which areas correspond to direct measurements and which to estimates generated by the model.
Frequently asked questions
What is Claude Science?
It is Anthropic's system that coordinated several artificial intelligence agents to download, calibrate, and merge data from different space missions to produce the first complete map of the sky in ultraviolet light.
Why was there no complete ultraviolet map of the sky before?
Because the ozone layer blocks ultraviolet radiation and it can only be measured from space, which limited observations to specific missions with different coverage and formats, which were difficult to combine.
What areas did NASA’s GALEX mission leave uncovered?
GALEX covered approximately two-thirds of the sky, but omitted bright star-forming regions, some of the most relevant for studying cosmic dust and the birth of stars.
What is the inpainting applied in this map?
It is a technique by which a model learns from existing data to reconstruct estimates in areas without direct measurements, similar to how damaged photographs are restored.
What margin of error do the reconstructed areas of the map have?
According to the tests described by Anthropic, the model's predictions in the estimated areas deviated on average by 10% from the actual measurements.
What is this ultraviolet sky map used for?
Anthropic presents it as educational material that shows how AI can take on tedious data work, allowing researchers to have a continuous map instead of building their own fusions of scattered data.